

How much of your commerce data can you trust when sales, ad spend, inventory, returns, shipping, and marketplace fees live in different systems?
As a brand expands across Amazon, Walmart, Shopify, TikTok Shop, carriers, and warehouse platforms, each system reports performance differently. The problem is not a lack of data. It is the gap between the numbers.
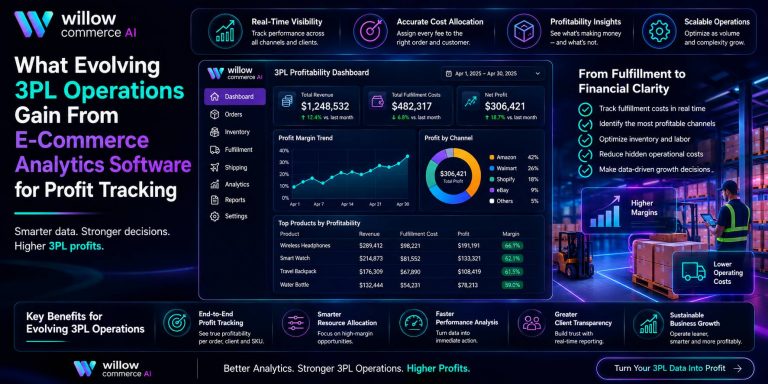
e-commerce analytics software closes that gap by bringing operational and financial signals into one reporting layer. An e-commerce profitability dashboard can then track margin by SKU, revenue by channel, return impact, ad efficiency, and stock pressure. The result is better decisions built from connected data.
How Connected Commerce Data Improves e-commerce analytics software Performance
Integrations reduce assumptions behind a metric. Revenue can look strong until teams subtract ad spend, shipping, returns, marketplace fees, and product cost. Inventory can look healthy until one channel sells faster than another.
Connected data adds context, so teams can compare channels on the same commercial basis rather than reconcile isolated dashboards.
Bring Marketplace Sales Into One Reporting View
A multichannel brand can sell the same SKU across Amazon, Walmart, Shopify, TikTok Shop, and other storefronts, yet every platform may define orders, cancellations, fees, and returns differently.
A unified layer brings those records together before teams compare channels. Finance can review net revenue while merchandising tracks unit velocity and operations watches order volume.
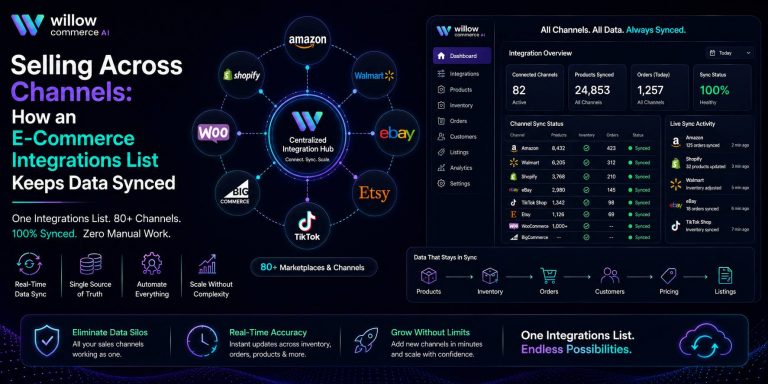
When e-commerce analytics software pulls marketplace data into one environment, channel comparisons rely less on manual exports.
Track Product Profitability Across Every Connected Channel
A product that sells well can still destroy margin. One channel may carry higher ad costs, another may generate more returns, while a third may charge higher marketplace fees.
An e-commerce profitability dashboard should combine those costs at SKU and channel level, so teams compare contribution margin instead of gross sales alone.
McKinsey reports that 65% of customers view targeted promotions as a top reason to purchase. If a promotion drives volume but erodes margin on a weak SKU, the campaign can look successful inside the ad platform while hurting profitability.
Link Inventory Levels With Sales Velocity and Demand
Inventory data means little without sales velocity. A stock position of 1,000 units could represent months of supply or a stockout risk within days.
Connected data lets teams review days of supply, order velocity, channel demand, returns, and reorder timing together. Inventory becomes a commercial signal rather than a static warehouse number.
We use this cross-channel structure at Willow Commerce to keep inventory decisions tied to current selling activity rather than stale stock totals.
Compare Shipping Costs and Delivery Performance Across Carriers
Shipping can hide margin leakage because carrier costs often stay outside sales reporting. Strong revenue can still depend on expensive services or slower routes that trigger refunds.
Integrated reporting exposes those tradeoffs.
| Metric | Why It Belongs in the Same View |
| Shipping cost per order | Shows fulfillment cost by channel or carrier |
| On-time delivery rate | Connects service quality with customer outcomes |
| Average transit time | Flags slower routes or service levels |
| Refunds tied to delivery | Exposes post-purchase cost |
| Margin after shipping | Shows whether revenue remains profitable |
Connect Advertising Spend With Revenue and Product Margins
Ad platforms report clicks, impressions, and attributed revenue. They rarely show the full economics after the sale.
A campaign with strong ROAS may still push buyers toward products with high returns, low margin, or expensive shipping. McKinsey says targeted promotions can create a 1% to 2% sales lift from better targeting.
With e-commerce analytics software, teams can compare ad spend with net revenue, product margin, returns, and channel costs before allocating the next dollar.
Spot Returns, Stockouts and Margin Changes Before They Grow
Analytics should help teams catch changes early, not only describe last month. A rise in returns may point to a product issue. Faster sales velocity may create a stockout. Higher carrier cost can cut contribution margin even when revenue stays flat.
Watching these movements together helps teams trace the symptom back to related operational data without opening several tools.
How Willow Commerce Turns Connected Data Into Actionable Analytics
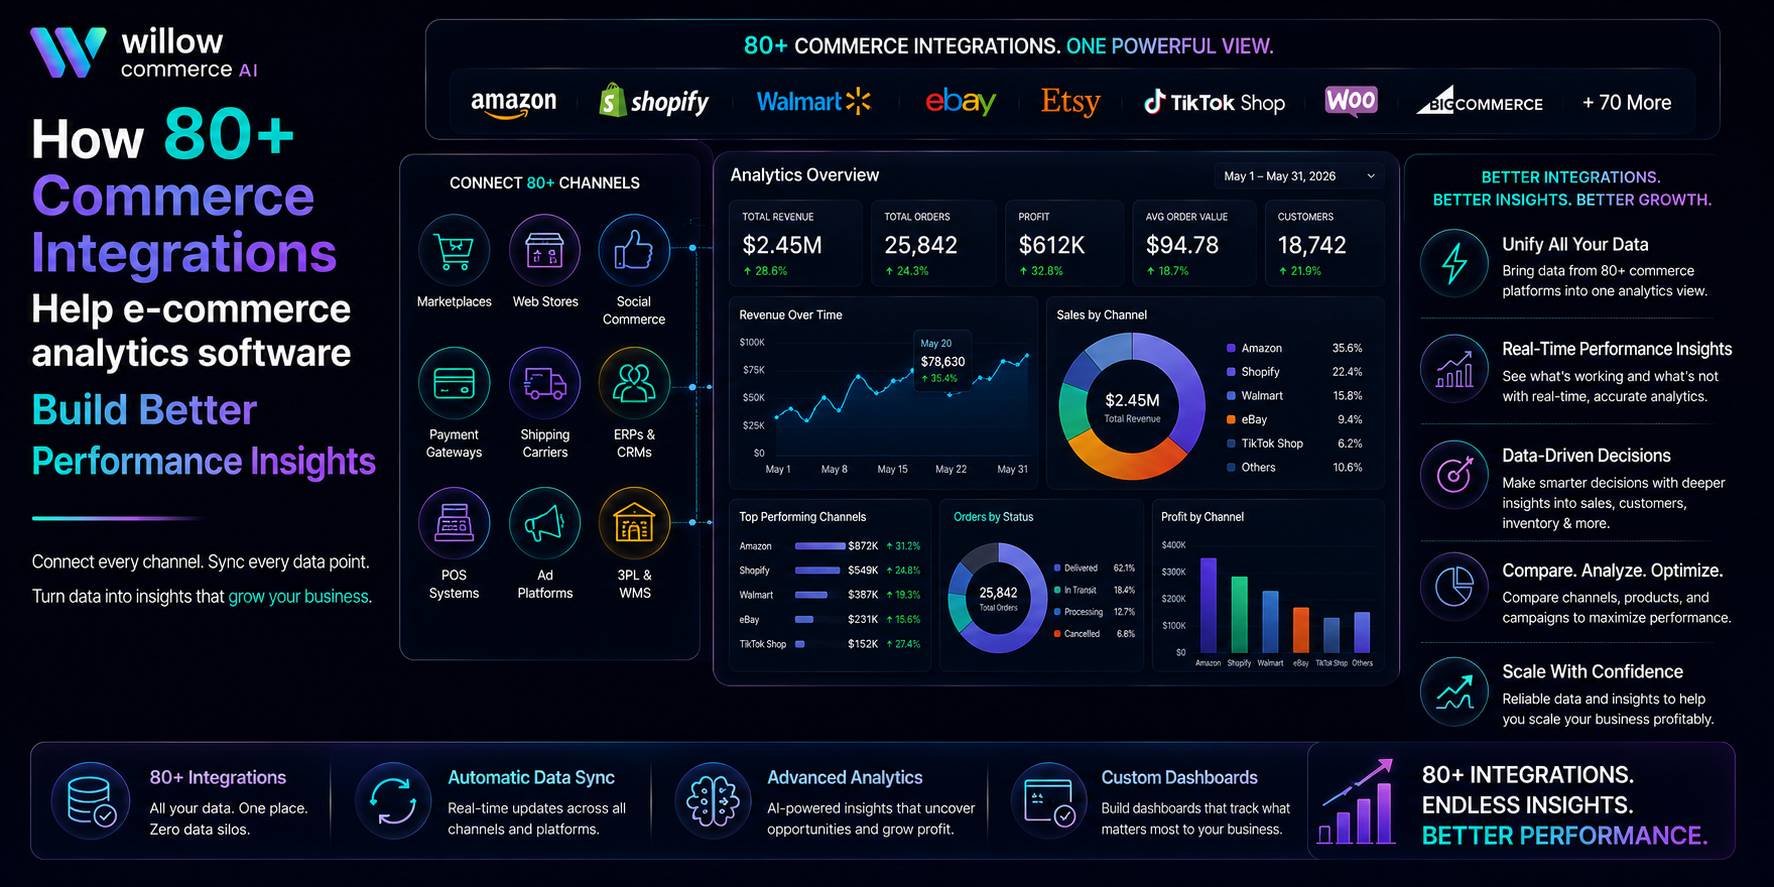
Willow Commerce connects marketplace, social-commerce, inventory, advertising, shipping, returns, and financial data so teams can review performance from one operating layer. The platform supports more than 80 commerce integrations, which reduces the work required to move data between systems.
We focus on a few areas that directly affect day-to-day decisions:
- Cross-channel reporting for revenue, conversion, ROAS, and channel performance
- SKU-level profitability using product cost, fees, shipping, ad spend, and returns
- Demand forecasting, stockout alerts, sales velocity, and inventory recommendations
The analytics layer also supports nine built-in report types, custom reporting, scheduled reports, anomaly detection, and natural-language questions. For social commerce, Willow Commerce can bring TikTok Shop, Instagram Shopping, and Facebook Shops into the same reporting environment as larger marketplaces.
The aim is not to create another dashboard. It is to reduce the gap between commerce activity and the decision that follows. That structure ties reporting to operational and financial outcomes.
What Businesses Can Gain From Bringing Commerce Systems Together
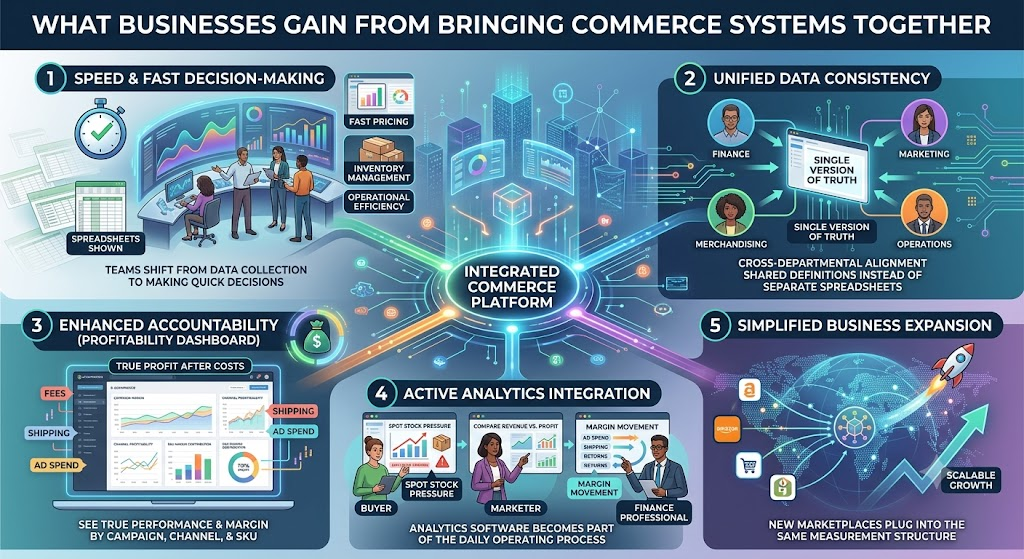
The first gain is speed. Teams spend less time collecting numbers and more time making pricing, inventory, media, and operational decisions.
The second is consistency. Finance, marketing, merchandising, and operations can work from the same commercial definitions instead of maintaining separate spreadsheets.
An e-commerce profitability dashboard also creates stronger accountability. It can show whether a campaign, channel, or SKU contributes margin after the business includes the costs behind the sale.
This is where e-commerce analytics software becomes part of the operating process. A buyer can spot stock pressure, a marketer can compare attributed revenue with profit, and finance can trace margin movement back to fees, shipping, returns, or ad spend.
Connected systems also simplify expansion because a new marketplace can feed the same measurement structure.
Conclusion: Better Integrations Lead to Better E-Commerce Decisions
More channels create more opportunity, but also more places for cost, inventory, and performance data to drift apart.
The value of e-commerce analytics software comes from connecting those signals before teams act. When revenue, advertising, shipping, inventory, returns, and product economics share one reporting structure, teams face fewer blind spots.
At Willow Commerce, we bring those connections into one analytics layer. If your team wants to add channels without adding reporting overhead, work with us to build a commerce data setup that supports growth while protecting profitability.
Frequently Asked Questions
What data should an e-commerce analytics platform collect first?
Start with orders, net revenue, product cost, ad spend, shipping, returns, fees, and inventory. Those fields support useful profit comparisons.
How often should commerce analytics data refresh?
Frequency depends on the decision. Inventory and order data may need near-real-time updates, while financial reporting can refresh daily.
What is the difference between revenue analytics and profitability analytics?
Revenue analytics tracks sales generated. Profitability analytics subtracts product cost, shipping, ads, fees, discounts, and returns from those sales.
Can integrated analytics reduce manual spreadsheet work?
Yes. When source systems feed one reporting layer, teams can replace recurring exports, reconciliations, and duplicate calculations.
Which teams should use commerce analytics reports?
Marketing, finance, merchandising, operations, inventory, and leadership can use different views of the same connected commerce data.